Outdoor Pollen Monitoring Networks and How to Use Them
Real-time pollen networks reveal hourly patterns that calendar counts can't capture.
Pollen seasons are starting earlier, running longer, and hitting harder than they used to. The rough calendar most allergy sufferers carry around in their heads is losing its value. Rising temperatures and higher CO₂ levels push plants to make more pollen and stretch the season on both ends, and peak concentrations now shift from year to year instead of landing on the same week each season. Memory and habit are no longer reliable predictors of exposure. Pollen monitoring networks exist to close that gap.
How traditional pollen monitoring networks work
Most of the pollen counts reported on the news or an app still trace back to a method built in the 1950s. A Hirst-type volumetric trap pulls in outside air and deposits pollen grains onto a sticky, rotating strip, and then a trained technician removes that strip and counts the grains by species under a microscope. This approach is standardized and quality-controlled across aerobiological networks, and it has remained the reference method for decades. But the process is manual from start to finish, and that has consequences for how useful the resulting numbers are on any given day.
The biggest one is lag. Data from these traps can take anywhere from one to nine days to become available. The count a person checks for "today" may describe conditions from the better part of a week ago. The trap's low temporal resolution and the uncertainties introduced by airflow variation, inconsistent counting methodology, adhesive quality, and differences between individual observers mean the number on the screen looks less like a precise instrument reading and more like an informed estimate.
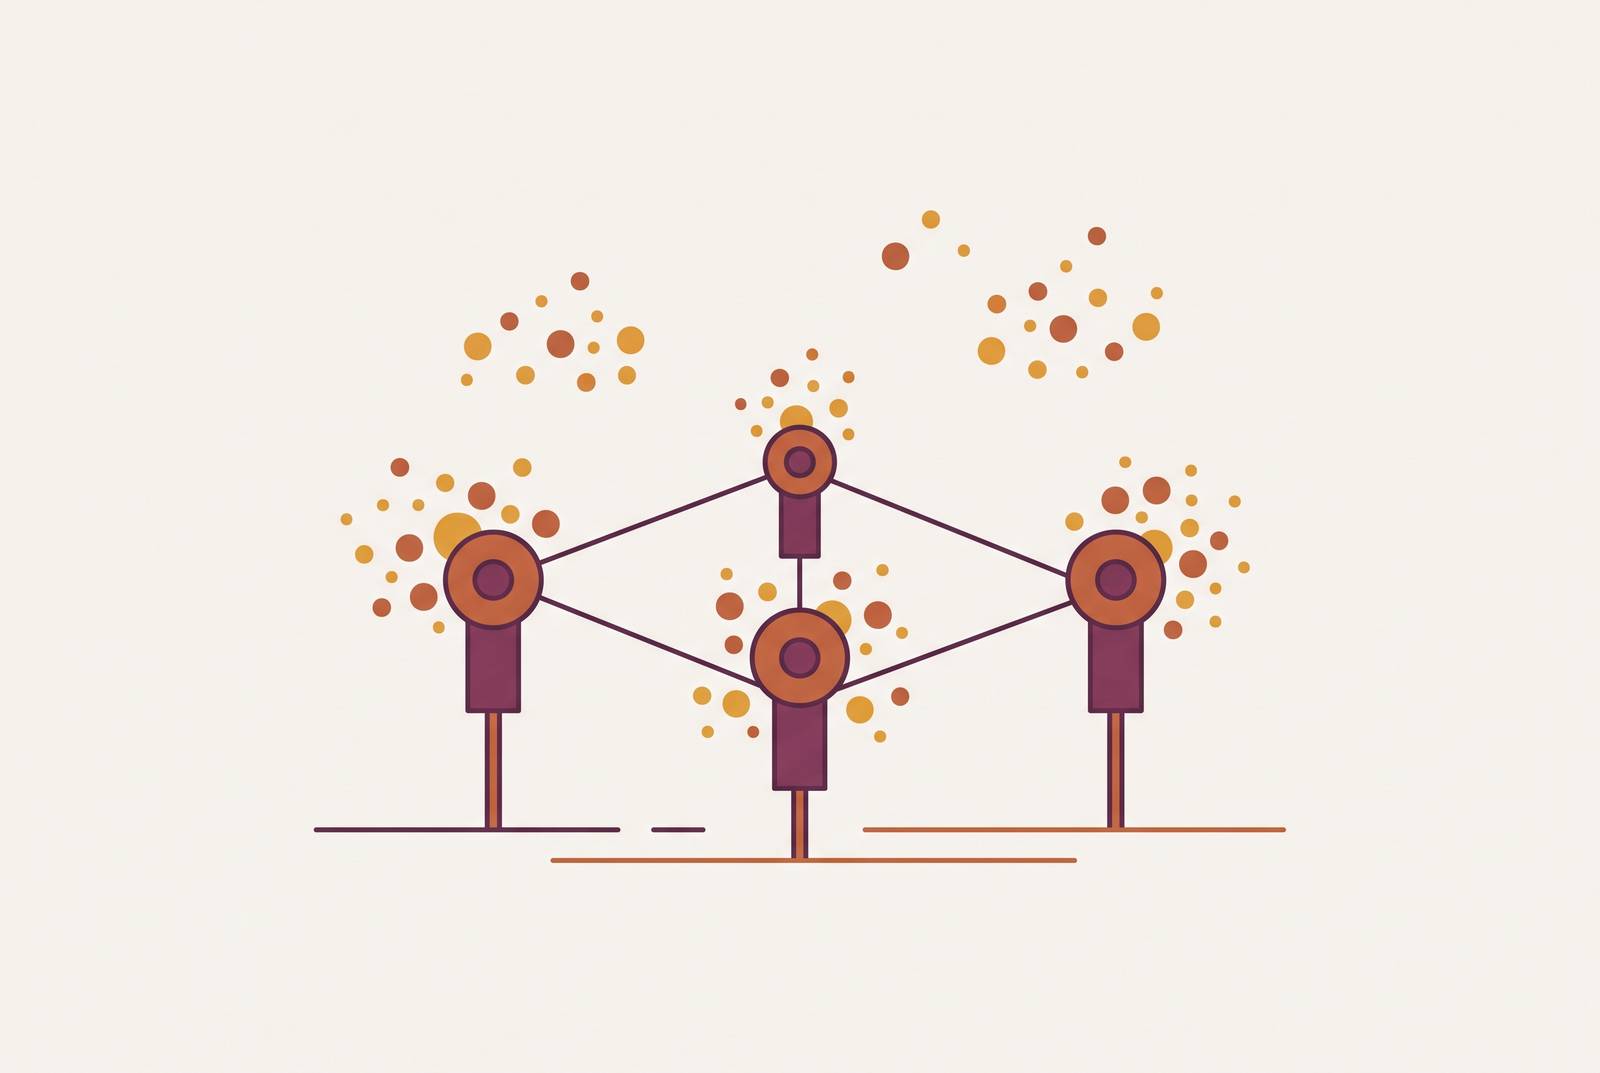
Geography is the second structural problem: most regions rely on a single monitoring station to stand in for an entire metro area, but one number can't capture how pollen concentrations vary block to block. The CCSD/UNLV Pollen Monitoring Program in Las Vegas shows what happens when a region actually tests that assumption: the program runs one NAB-certified site at UNLV alongside four Clark County School District sites, plus a control site out in Jean, Nevada, with samples collected weekly year-round. Published research built on that network found meaningful variation in airborne pollen concentrations across the five locations, all within a single desert urban environment. If that much variation appears across one city in Clark County, a single regional count anywhere else is, at best, an average standing in for conditions that differ meaningfully by neighborhood.
What real-time, automated monitoring can do
If manual traps are slow and sparse, the obvious question is what replaces them. A 2026 study in Atmospheric Measurement Techniques by Tomczyk et al. tested an answer in Wrocław, Poland, across the 2024 and 2025 seasons, using the Swisens Poleno Jupiter, an automated detector that identifies pollen in real time rather than waiting on a technician's microscope. The researchers found that a neural network model retrained on local Wrocław data outperformed the reference model originally trained on Swiss datasets, and the hourly analyses it produced revealed distinct, taxon-specific patterns in when different plants release pollen over the course of a day.
That hourly resolution is the real advance, because it exposes how much pollen counts move in response to weather rather than the calendar. Temperature and relative humidity turned out to be the main drivers of pollen variability; wind speed influenced nearly every pollen type studied except pine; wind blowing in from the south and southeast modulated how pollen moved across the region. A single daily number can't carry any of that. It also matters how high the atmosphere mixes during the day: hourly pollen concentrations correlated positively with planetary boundary layer height, particularly for birch and alder, meaning pollen disperses more widely as the air column mixes, with different species peaking at different hours.
Commercial infrastructure in the U.S. is moving the same way. Pollen Sense operates APS400 sensors that combine optical detection, AI, and environmental science to measure pollen alongside mold, dust, and smoke, feeding sensor networks, licensed datasets, and the consumer-facing Pollen Wise app. A parallel effort, the PollenNet project, a collaboration between the Technical University of Ilmenau, the Max Planck Institute for Biogeochemistry, the Helmholtz Centre for Environmental Research in Leipzig, and the University of Leipzig Medical Center, installed 40 pollen traps across Leipzig, Jena, and Ilmenau, and links pollen and plant observations with participant-reported allergy symptoms and medication use. That citizen-science layer matters because it reaches into gaps that expensive sensor hardware can't economically fill on its own.
Cost remains the limiting factor for all of this. Automated sensors still cost enough to restrict how densely they can be deployed, and developing lower-cost versions is explicitly flagged as necessary before real-time coverage can expand to match the scale of legacy networks. AI forecasting platforms reviewed in a 2026 paper in Exploration of Asthma & Allergy by Corriger et al. combine aerobiological data, meteorological models, and patient-reported outcomes to produce more personalized, more timely alerts, but that technology only helps if allergologists and patients both understand what the resulting outputs actually mean.
What Pollen Count Numbers Mean
A pollen count on its own is a population statistic rather than a personal forecast. Programs like CCSD/UNLV classify daily counts into bands, Absent, Low, Moderate, High, and Very High, with each band keyed to the proportion of sensitized people likely to feel symptoms at that level. That scale is a legitimate starting point, but it describes a population of allergy sufferers in aggregate, not the specific person checking the app before walking the dog.
Species matter as much as the total count. A "high" reading dominated by a pollen type a given person isn't sensitized to carries no real risk for that individual, while a "moderate" count of their actual trigger species, hitting at the wrong hour, can do more damage than a bigger number attached to the wrong plant. Weather context gets lost in translation too. The hourly data out of Wrocław shows temperature, humidity, wind direction, and boundary layer height all driving variability within a single day, so a dry, warm, windy midday behaves nothing like a cool, humid morning even when both get logged under the same calendar-day count.
A fair objection here: isn't a high count warning enough on its own? Only if the person checking it knows which pollen type is elevated, whether they're actually sensitized to it, and roughly when that day's peak will hit. If you strip away any one of those three filters, the number stops functioning as useful signal.
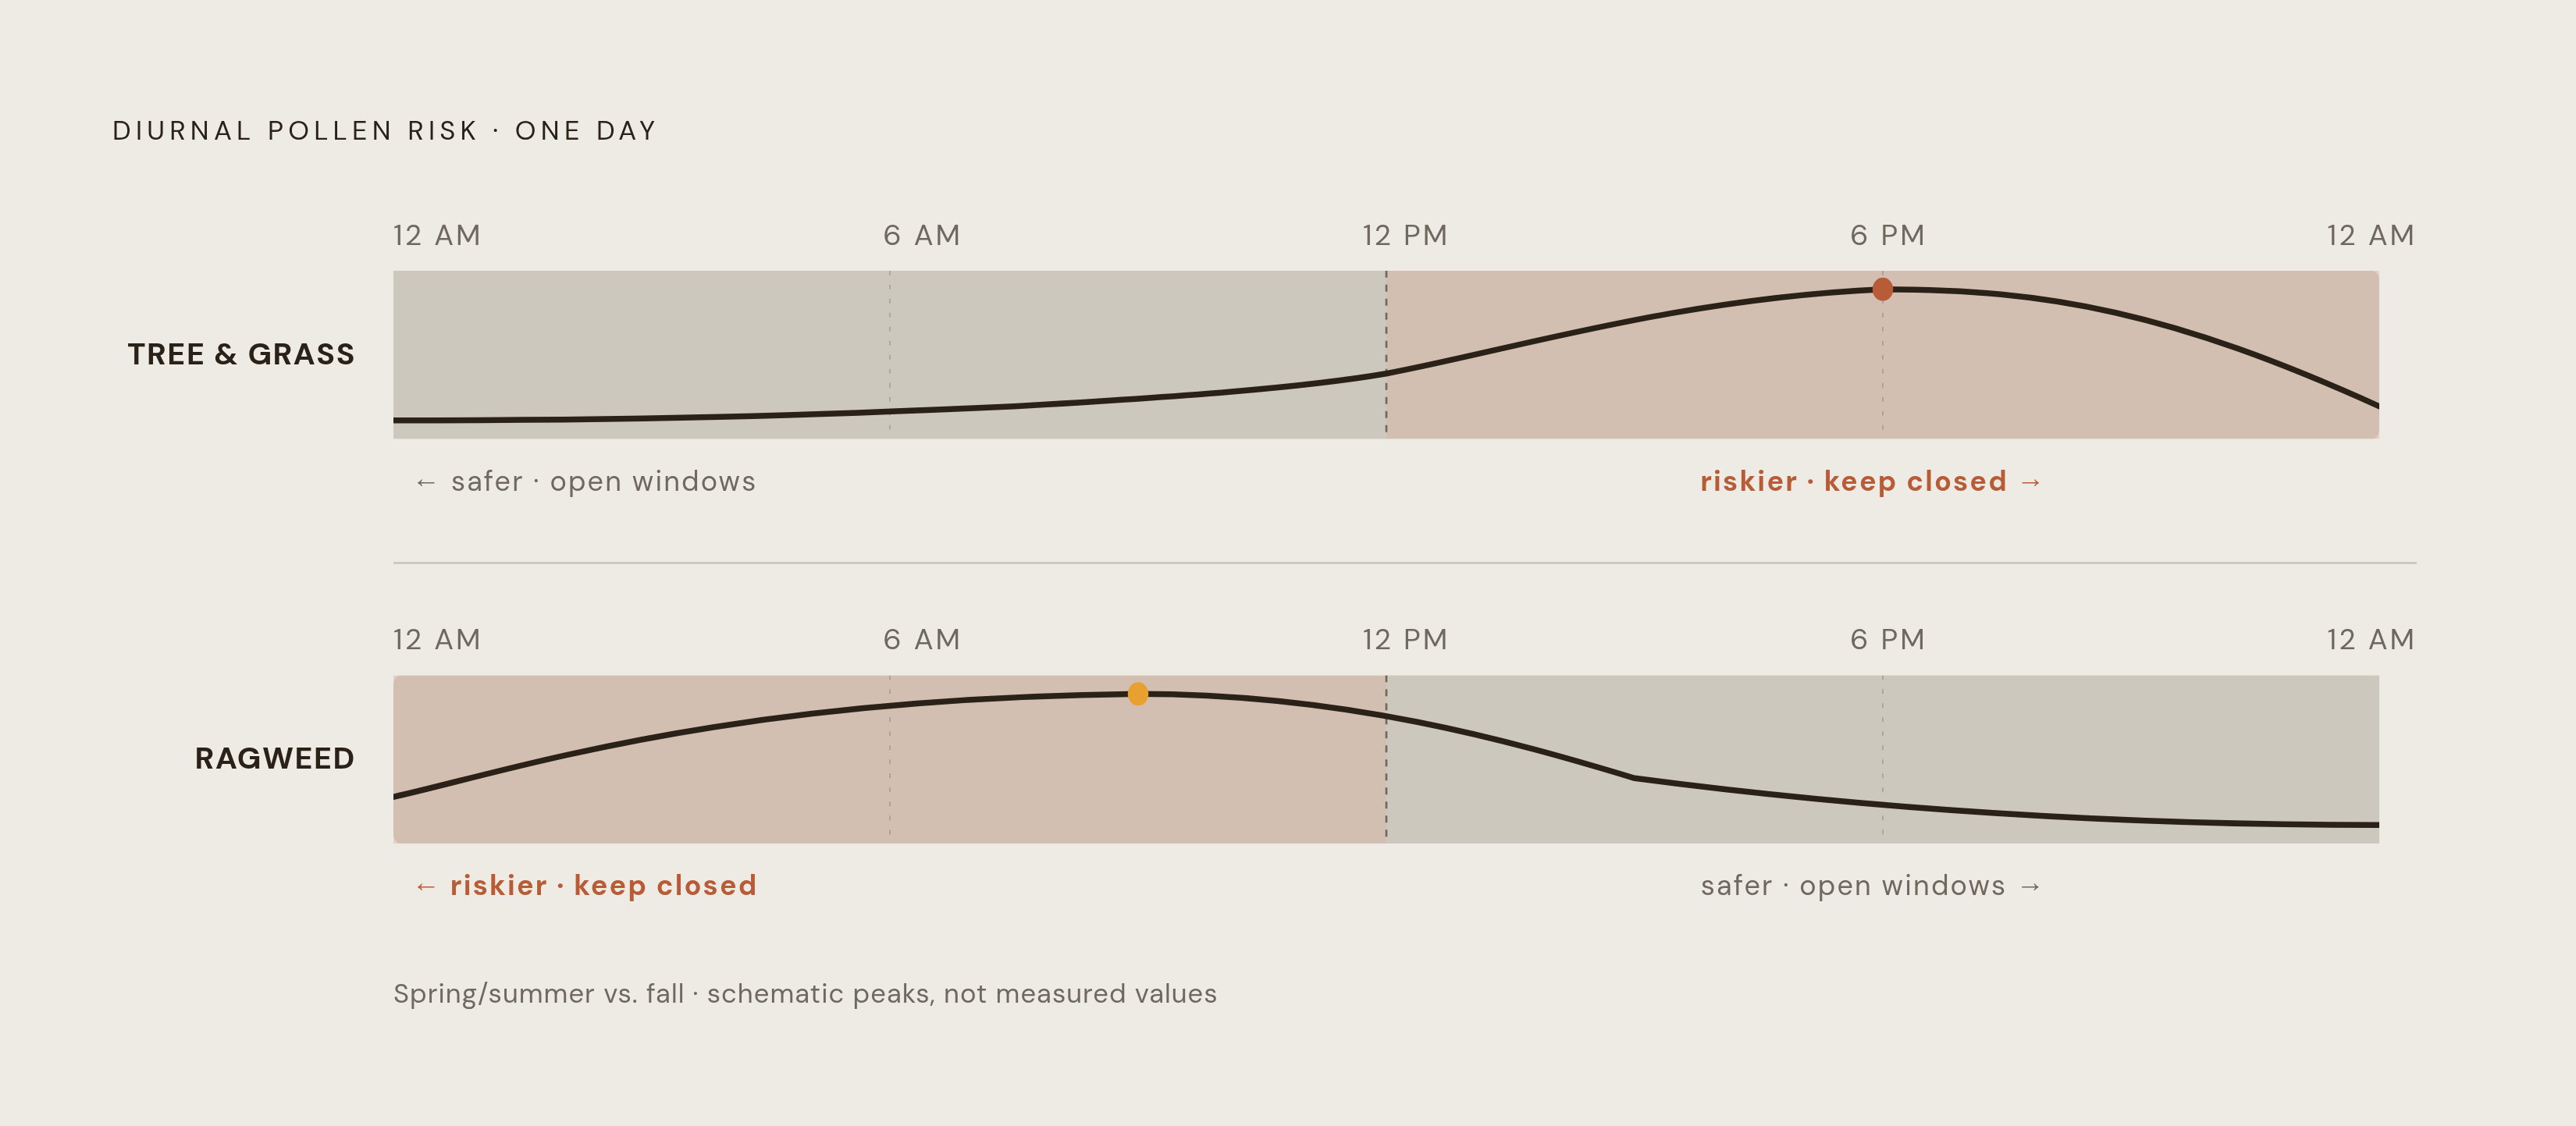
The diurnal pattern itself is concrete, and you can build a routine around it. Tree and grass pollen, the dominant allergens of spring and summer, tend to peak in the evening, so late afternoon and evening are the riskier window for outdoor exposure, and mornings are safer for airing out a house. Ragweed, the dominant fall allergen, runs the opposite schedule and peaks in the morning, so the same logic flips: mornings become the time to keep windows shut, and afternoons, once counts have usually dropped, become the safer stretch. That single fact, species-specific timing, is what turns an abstract daily number into something you can act on tonight.
Translating daily readings into concrete exposure decisions
Checking a pollen count protects anyone only once it's paired with a bit of personal and situational context. The first step has nothing to do with the app or the forecast: a person needs to know which pollen type triggers their own symptoms, because without that filter, a mixed-count day is just noise regardless of how precise the underlying sensor is. From there, checking local hourly counts lets a person time outdoor errands around the lower-count stretches of the day, since tools like the Pollen Sense and Pollen Wise app offer real-time particle readings rather than next-day estimates, where that hourly data exists.
The timing rules from the previous section tell you how to manage your windows and doors. In spring and summer, when tree and grass pollen are in season, keep windows closed in the late afternoon and evening, since that's when those pollens peak, while mornings tend to be safer for letting air into the house. Once ragweed season arrives in late summer and fall, that logic reverses: windows should stay closed overnight and through the morning, when ragweed peaks, with the afternoon offering a better window for ventilation if counts have dropped by then.
Weather itself functions as an early warning system, well before any hourly reading gets published. Dry, warm, windy days push counts up regardless of what the calendar says, while humid or rainy conditions tend to suppress airborne pollen, so cross-referencing the day's weather forecast against the expected count gives a directional sense of risk even ahead of the official numbers. What happens after time spent outside matters just as much as the timing decision itself. Showering, washing hair, and changing clothes after outdoor activity clears pollen that would otherwise keep triggering symptoms indoors long after someone has come back inside, a point the CCSD/UNLV program's seasonal allergy guidance makes directly. For higher-exposure tasks like mowing the lawn, a NIOSH-rated 95 filter mask paired with appropriate premedication beforehand cuts down meaningfully on what gets inhaled during the job itself.
The last piece of the framework is the one that turns a season of guesswork into a season of pattern recognition: keeping a symptom journal alongside the daily and hourly counts. If you log symptoms against the actual numbers over weeks or months, you find a personal sensitization threshold more precise than any population-level classification, since a moderate count might reliably trigger one person's symptoms while leaving someone else with an identical diagnosis unaffected. That journal becomes the evidence base for the next, harder question: whether avoidance, done as well as it can possibly be done, is actually enough.
Why avoidance alone fails most sufferers
Even a person who checks hourly counts, times every outdoor errand, closes windows on schedule, showers immediately after yard work, and wears a mask while mowing is still working within a limit that no amount of behavioral precision can push past. Avoidance reduces dose. It does not touch the underlying mechanism driving the reaction in the first place, and repeated seasonal exposure can actually worsen the immune system's allergic response over time and expand it to cover new allergens it didn't previously react to.
Sufferers can see the cost of that ongoing exposure in places they don't always connect back to their allergies. Allergic reactions release cytokines that circulate through the bloodstream, and when that process disrupts histamine balance and cytokine signaling, both energy levels and mental sharpness can decline as a result. Congestion often gets worse at night, when swollen nasal tissue restricts airflow and pushes a person toward mouth breathing, a pathway that disrupts normal sleep architecture and carries downstream health consequences. Children appear to carry a measurable version of this same cost: data shows children performing worse on standardized tests during periods of higher pollen counts. None of this registers as an emergency. It accumulates as a quiet drag on function, day after day, for as long as the season runs.
If symptoms are mild, an over-the-counter antihistamine may be all that's needed. The cognitive and sleep costs described above are productivity losses whether or not they feel dramatic in the moment, and years of ongoing allergic inflammation carry risks of airway remodeling, so it's more rational to address the problem earlier.
Monitoring data, used well, can minimize exposure. It can't change what the immune system does once exposure happens, so the only treatment shown to modify the underlying disease process, rather than just manage dose, is allergen immunotherapy. It stands as the only potentially disease-modifying treatment available for IgE-mediated respiratory allergy, and sublingual immunotherapy tablets in particular have shown clinically meaningful, well-supported reductions in symptoms and medication use, with benefits that persisted one to two years after completing a three-year course. SLIT acts on both the humoral and cellular arms of the immune system, raising allergen-specific IgG4 and reducing the recruitment of pro-inflammatory cells like basophils, which is the immunological mechanism behind that durability. Monitoring networks, legacy and real-time alike, do the essential work of telling a sufferer when and where the risk is highest. What they were never built to do is change the body's response once that risk arrives, and that's the boundary every well-informed allergy sufferer eventually runs into.
Sources
- AMT - Real-time pollen dynamics and automated detection: novel insights from Wrocław (Poland) 2024–2025
- EGUsphere - Real-Time Pollen Dynamics and Automated Detection: Novel insights from Wrocław (Poland) 2024–2025
- Artificial intelligence in pollen forecasting and patient monitoring: a practical guide for allergologists
- Pollen Sense
- CCSD/UNLV Pollen Monitoring Program
- PollenNet Study 2026
- Frontiers